Project Brief
In this project, we had to create your own library using vanilla javascript for others to use. Considering toolmaking as a creative practice, we had to create a new p5 libraries that proposed a helpful feature or creating an alternative imagination for what's possible while using p5.
Documentation
This project is a data visualisation library that makes creating charts and graphs from CSV files easier to assemble. Letting you customise background colours, the key, and the data points in P5.js to allow maximum customisation of the sketch.
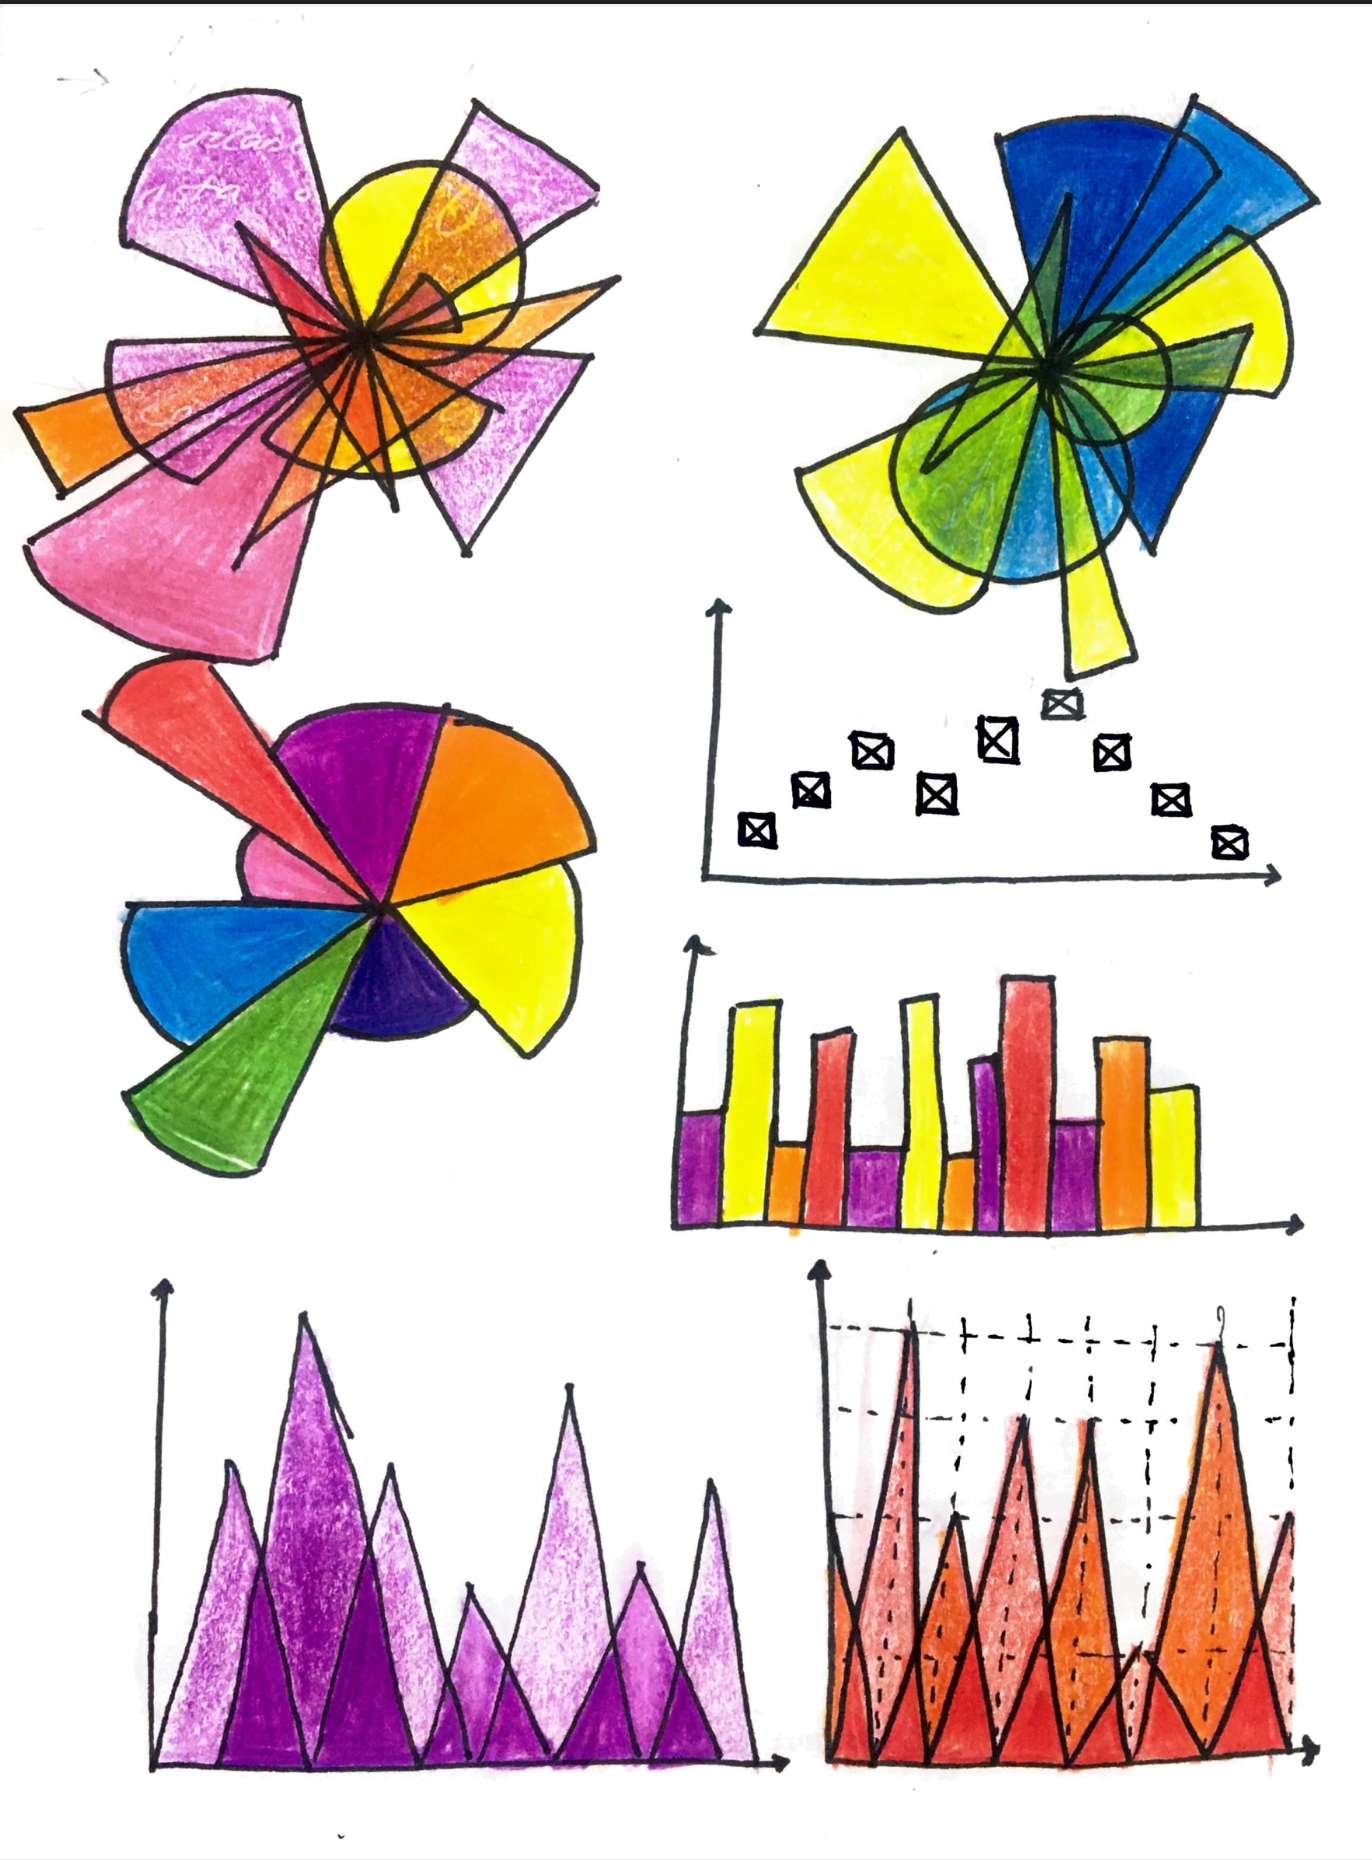
There 6 types of visualisations created using this library.
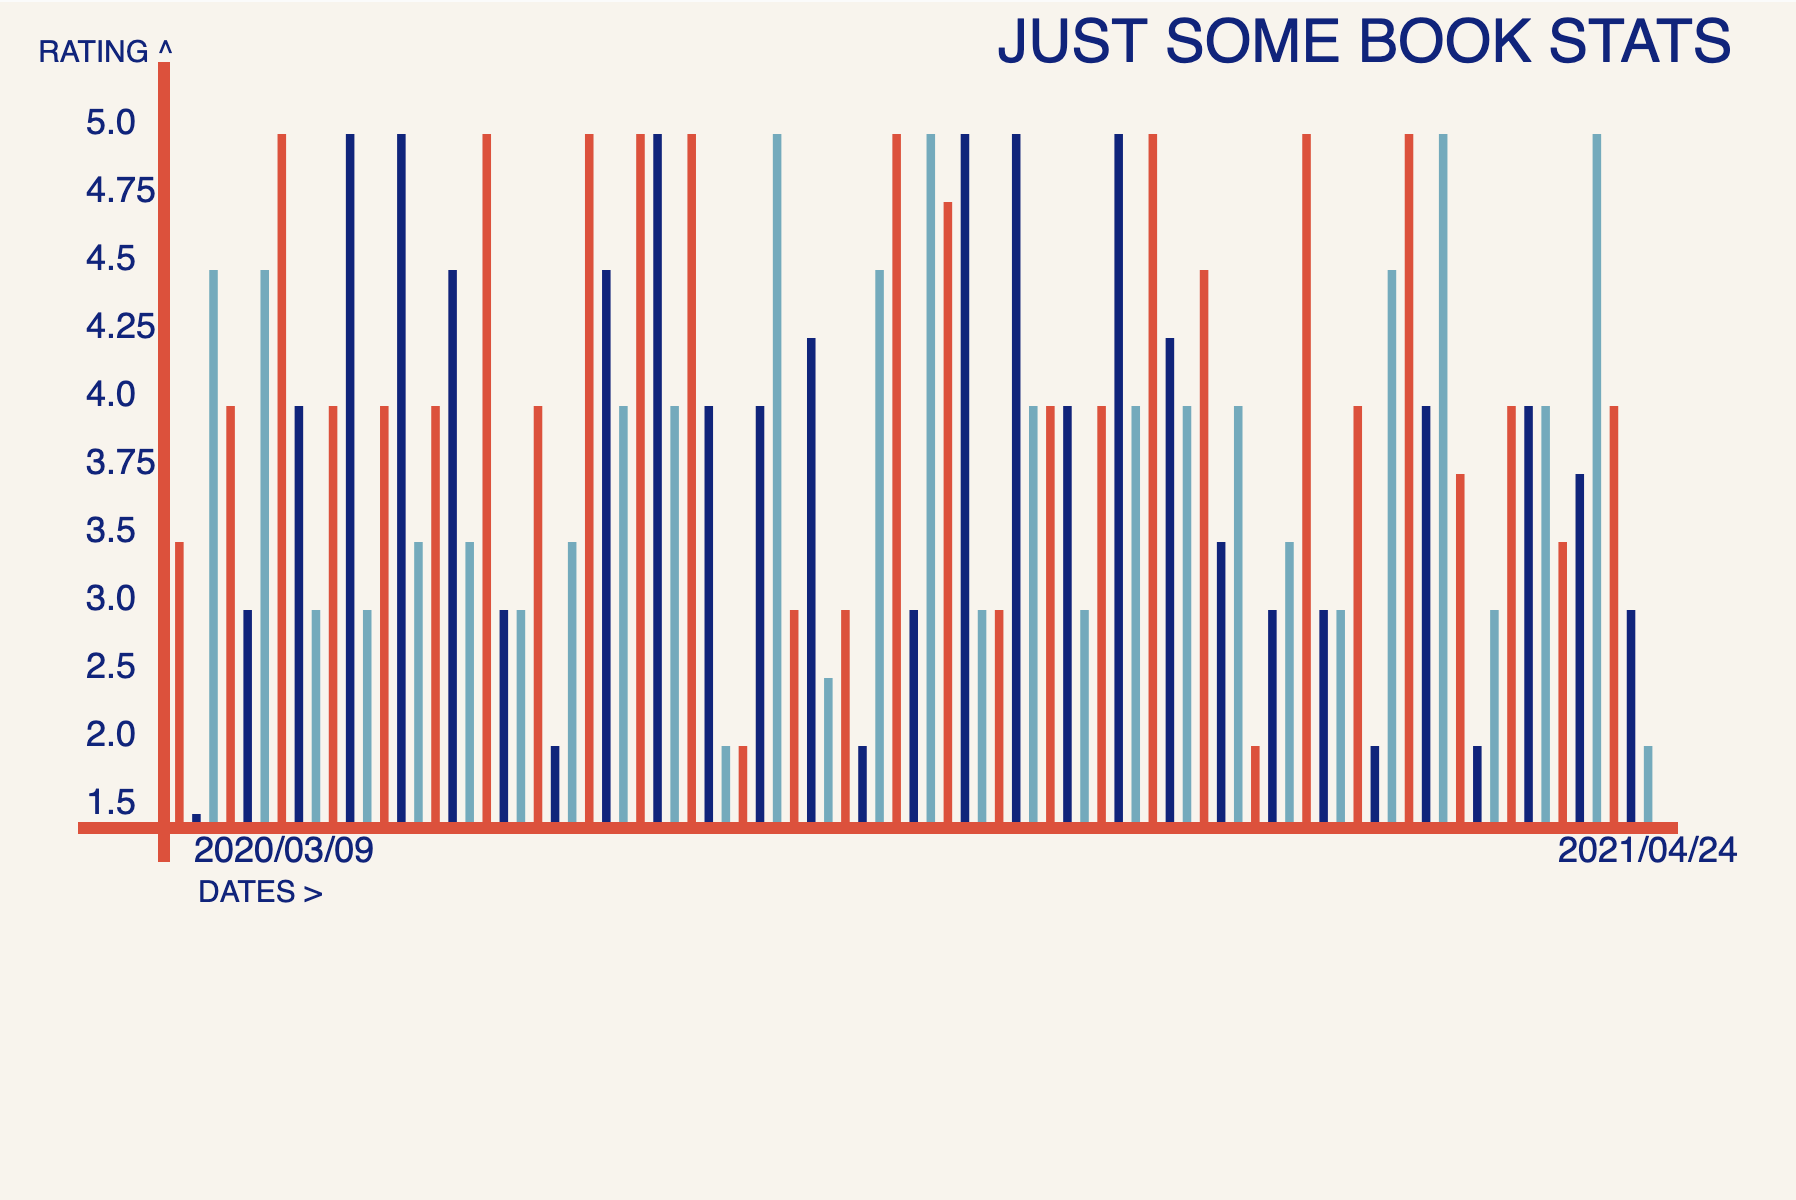
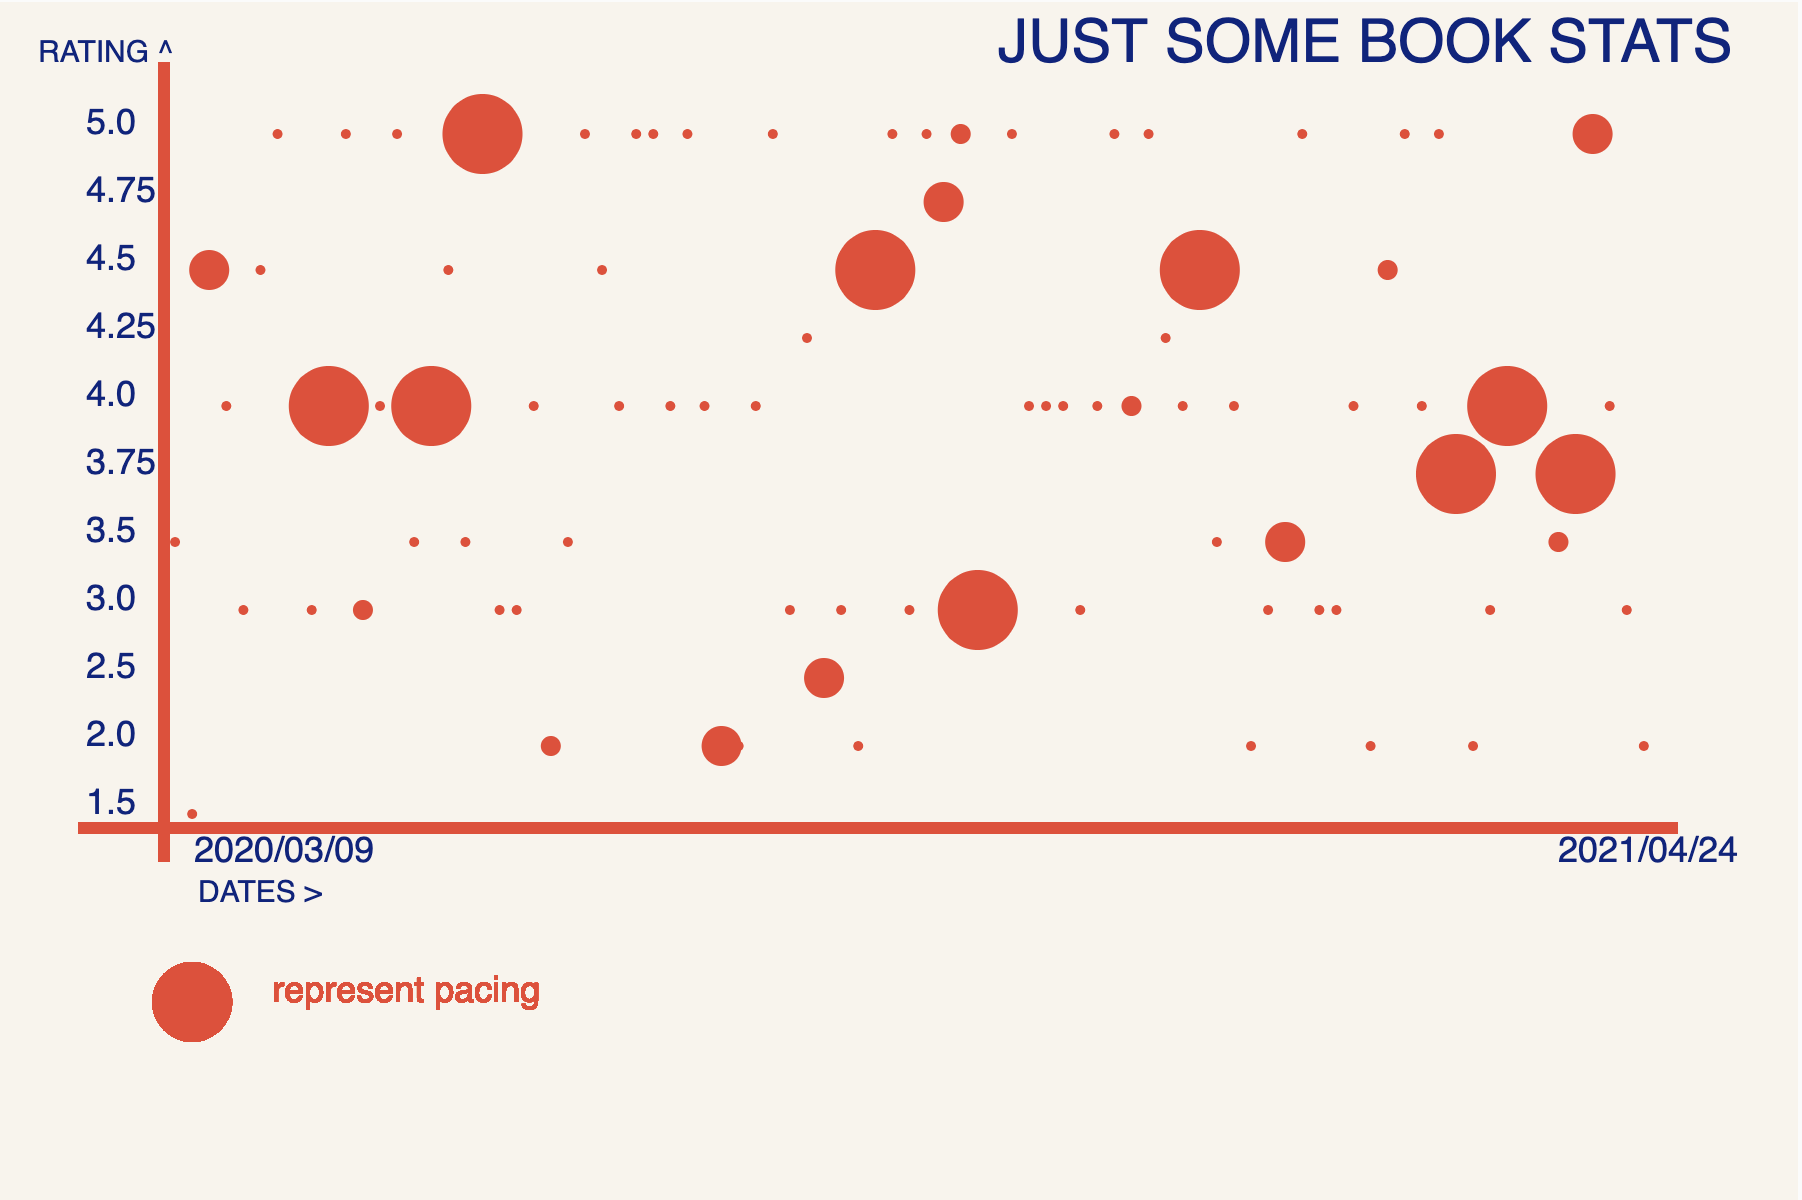
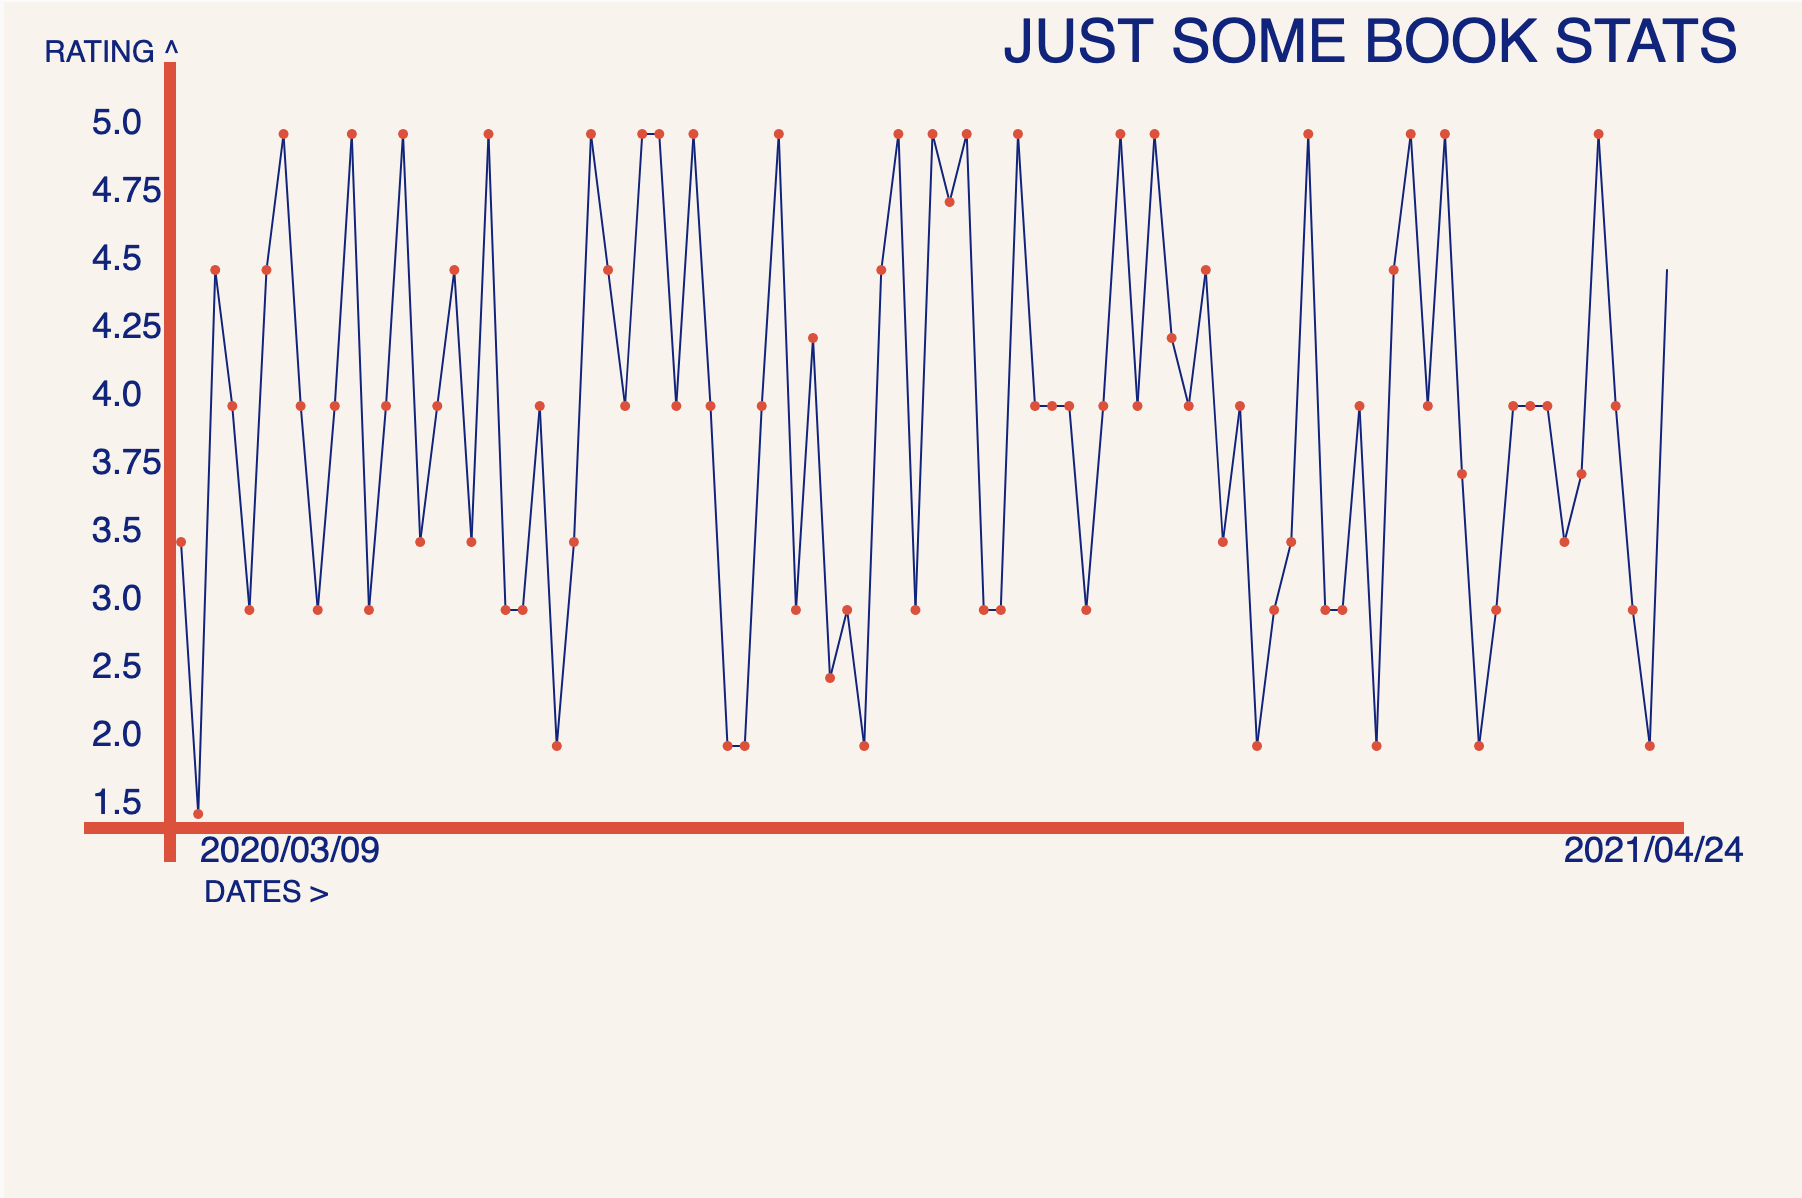
Graph
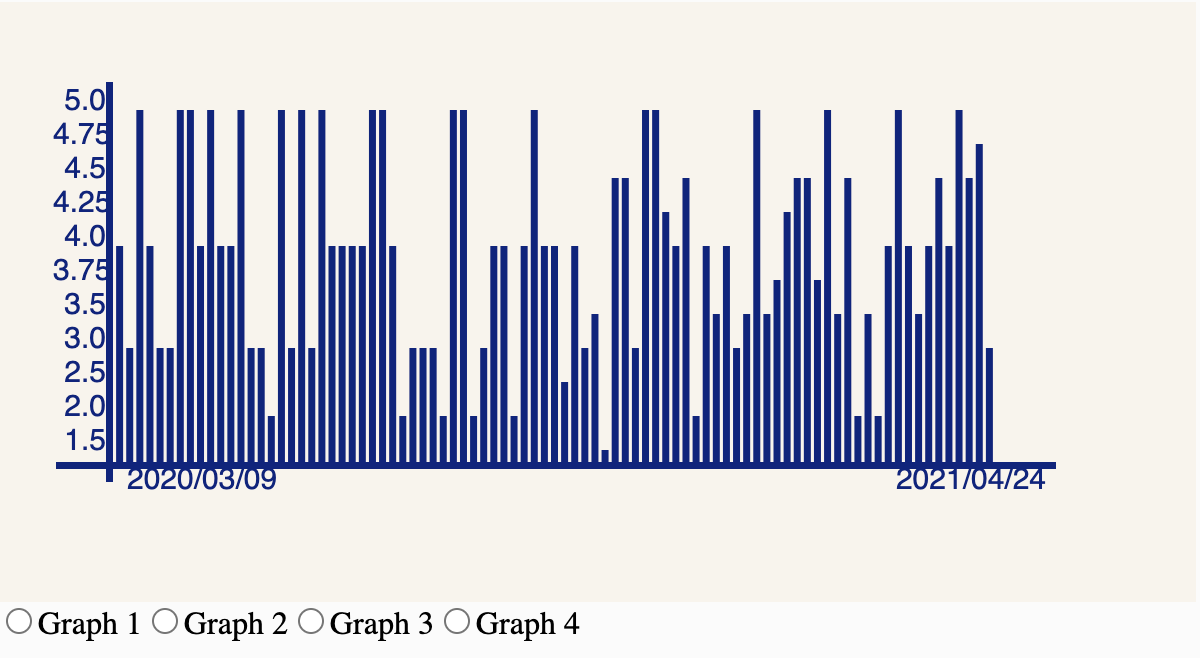
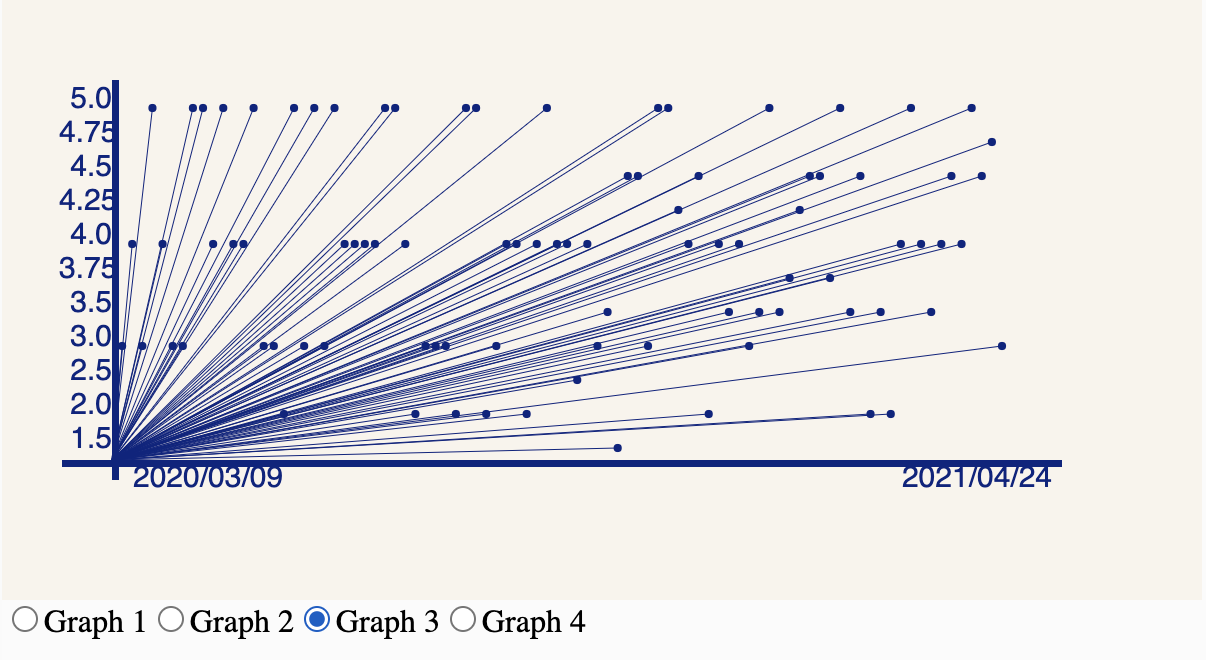
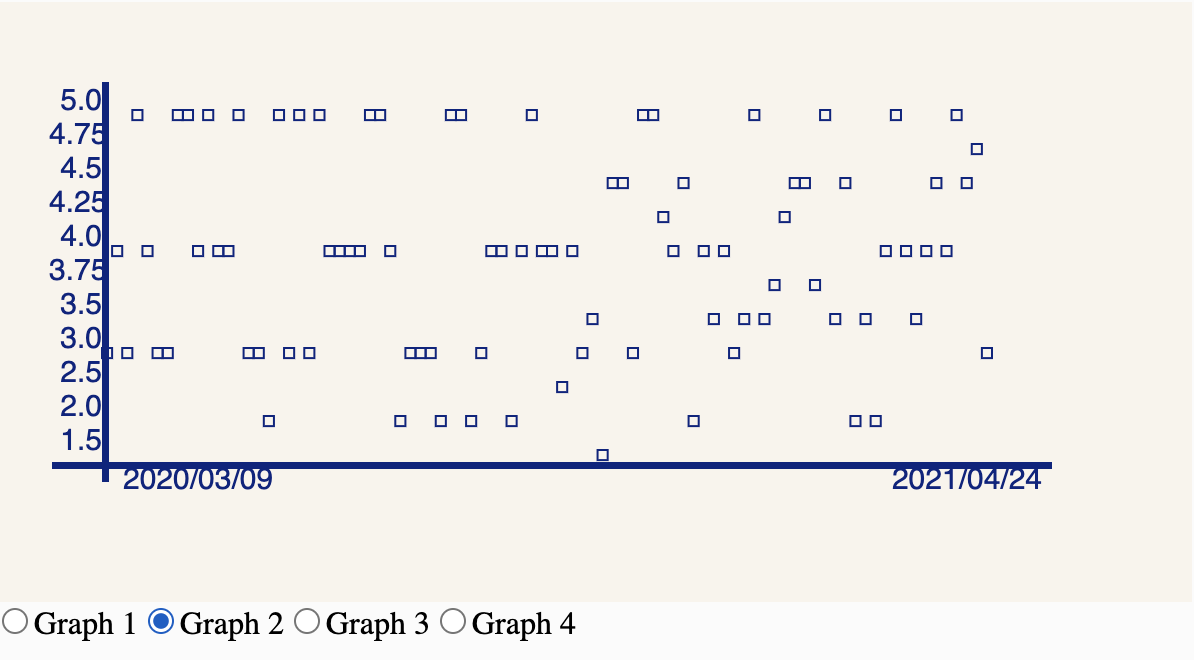
Functions:
graphClass(fileName, uniqueTitle, xTitleArray, yTitleArray, [xPos], [yPos],[graphWidth], [graphHeight], [fillcolor],[textsize])
a. fileName: expected input string of the CSV file from where data is pulled
b. uniqueTitle: expected input array with all unique elements from the CSV file
c. xTitleArray: expected input array with the x-axis values from the CSV file
d. yTitleArray: expected input array with the y-axis values from the CSV file
e. xPos : expected input integer as the x-coordinate of origin of the graph; default value=0 (OPTIONAL)
f. yPos: expected input integer as the y-coordinate of origin of the graph; default value=0 (OPTIONAL)
g. graphWidth: expected input integer as the graph width; default value=width of canvas (OPTIONAL)
h. graphHeight: expected input integer as the graph height; default value=height of canvas (OPTIONAL)
i. fillcolor: expected input as hex value; default value = “#000000” (OPTIONAL)
j. textsize: expected input as integer value used as the default value for all text size; default value = 5 (OPTIONAL)
mainHeader(MainHead, xPos, yPos, [txtSize], [fillColour])
a. Main Head: expected input as string value forming the text on the graph
b. xPos: expected input as integer value decides the x-coordinate of text (used for positioning)
c. yPos: expected input as integer value decides the y-coordinate of text (used for positioning)
d. txtSize expected input as integer value for the text size; default value=20 (OPTIONAL)
e. fillColour: expected input as hex value for the text colour; default value=‘#f9f4ec’ (OPTIONAL)
drawAxis()
This function draws the x axis and y axis and requires no inputs
plottingXvalues()
This function draws the x axis values and requires no inputs;
the function may be expanded on in the future
plottingYvalues()
This function draws the x axis values and requires no inputs;
the function may be expanded on in the future
plottingPoints([value])

value: expected input as 0,1 or 2; changes the type of graph
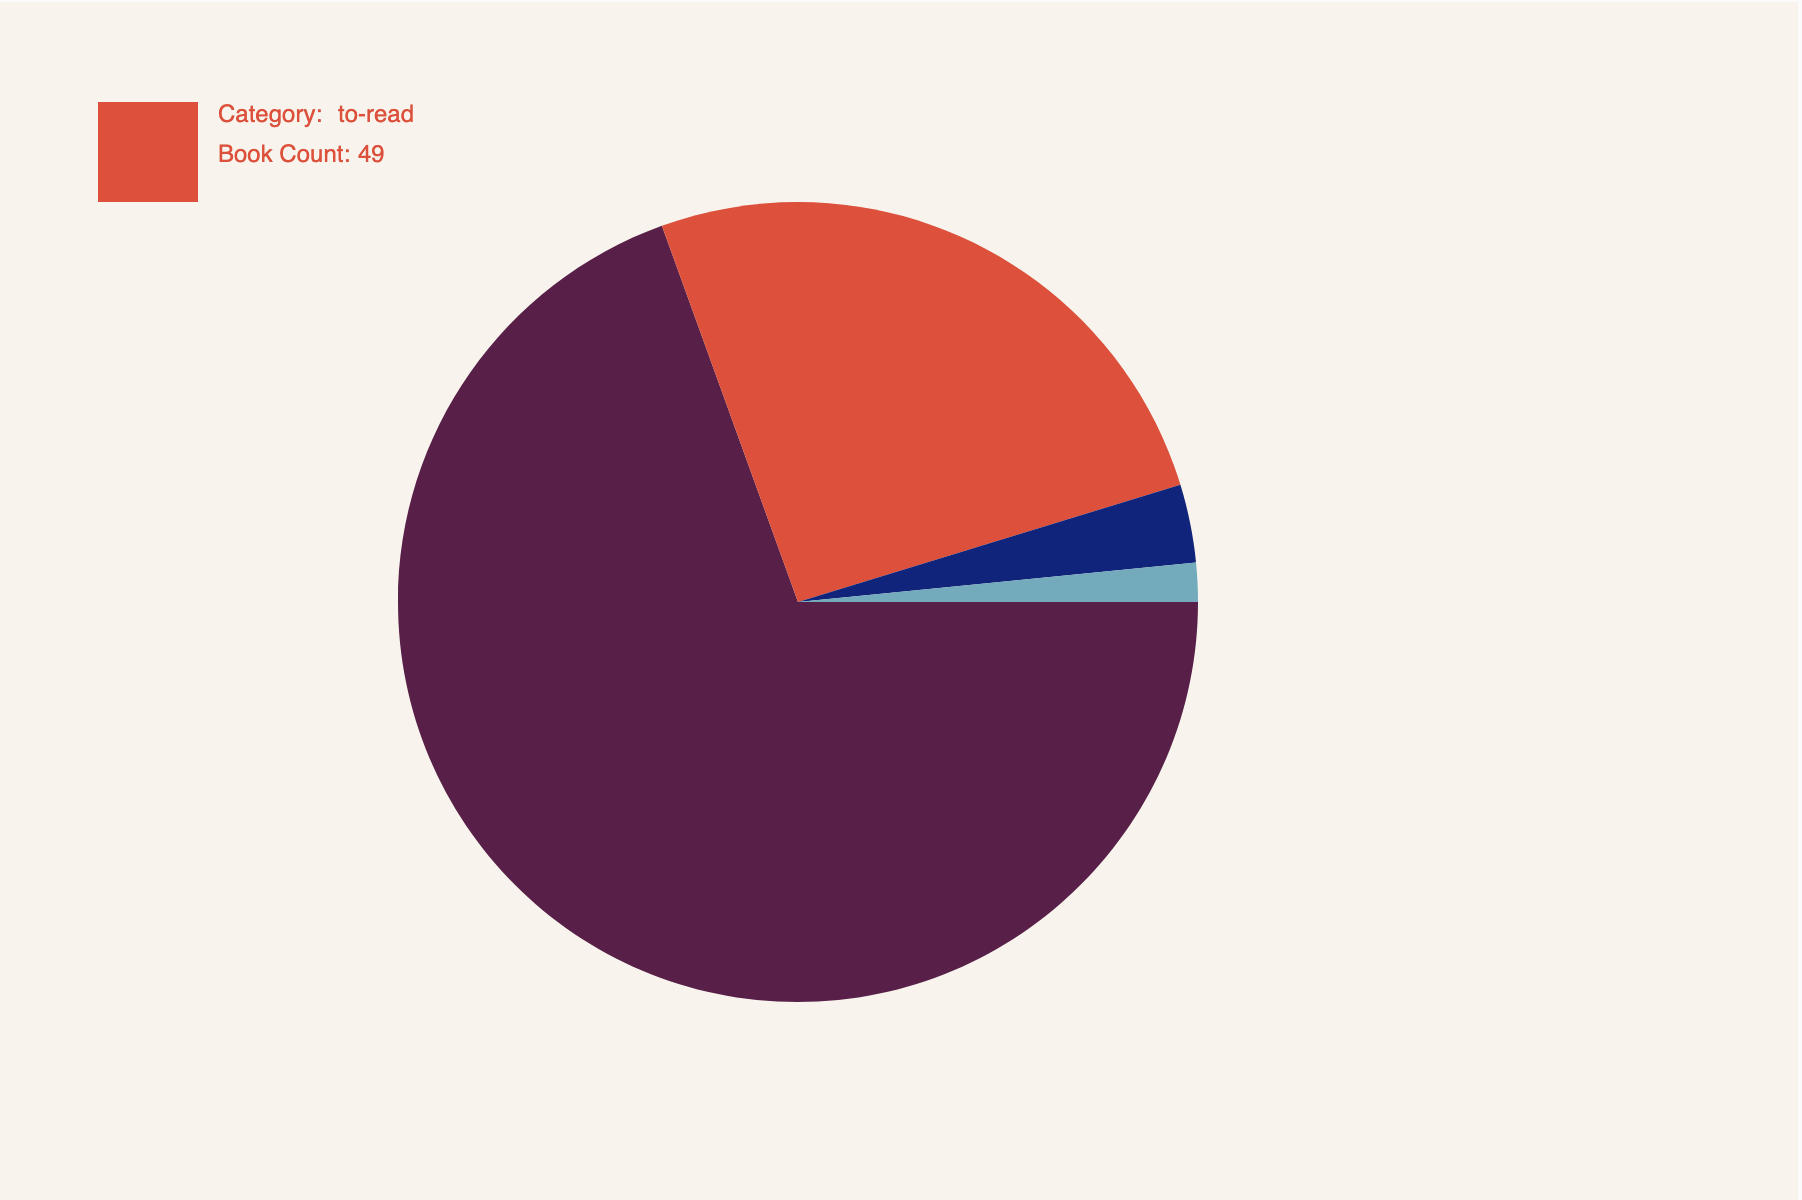
Pie-Chart
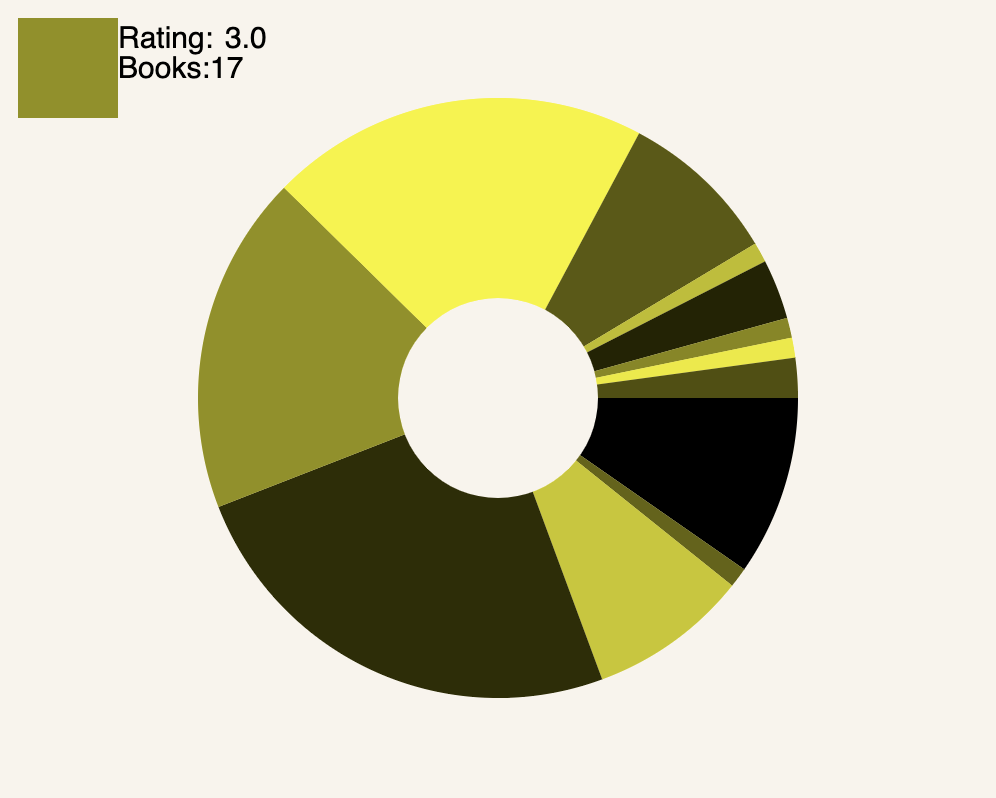
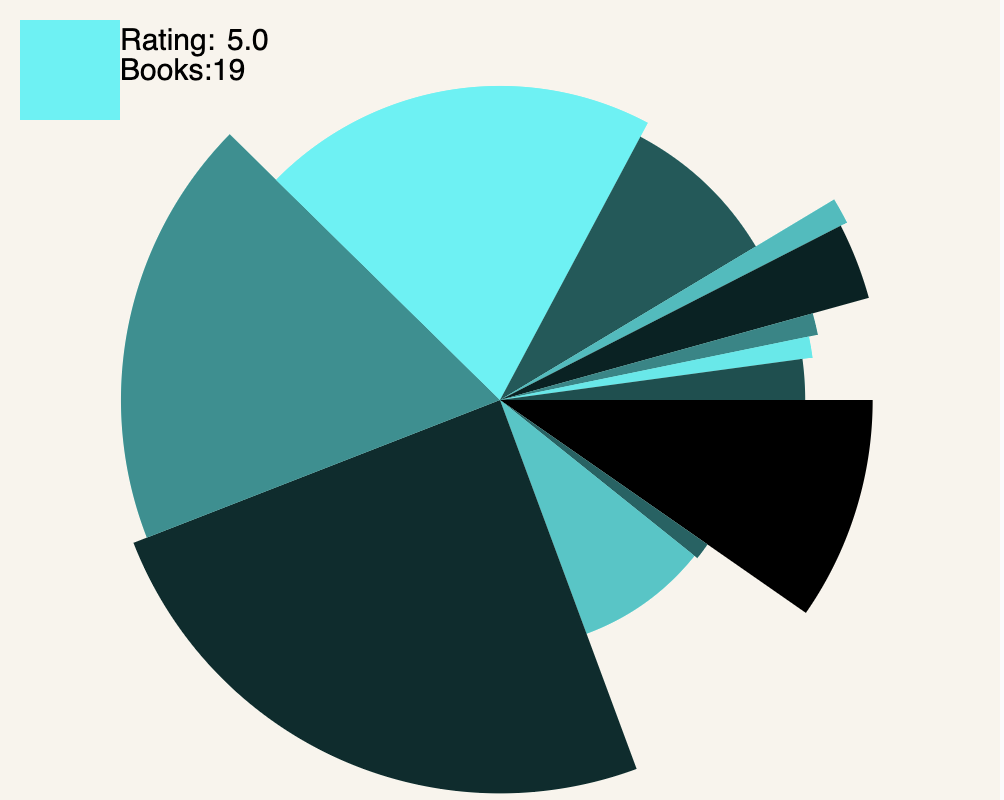
Functions:
pieClass(fileName, groupTitleArray,[uniqueTitle],[count], [xPos],[yPos],[pieWidth],[pieHeight],[radius],[shape],fillcolor="#000000",textsize=15)
a. fileName: expected input string of the CSV file from where data is pulled
b. groupTitleArray: expected input array containing the grouping value elements from the CSV file (e.g., [slow,medium,fast])
c. uniqueTitle: expected input array with all unique elements from the CSV file; default value=‘null’ (OPTIONAL)
d. count: expected input array with the elements used to count and create the wedges of the pie chart from the CSV file; default value=‘null’ (OPTIONAL)
e. xPos: expected input integer as the x-coordinate of origin of the pie chart; default value=0 (OPTIONAL)
f. yPos: expected input integer as the y-coordinate of origin of the pie chart; default value=0 (OPTIONAL)
g. pieWidth: expected input integer as the pie chart width; default value=width of canvas (OPTIONAL)
h. pieHeight: expected input integer as the pie chart height; default value=height of canvas (OPTIONAL)
i. radius: expected input integer as the pie chart radius; default value=height of canvas/2 (OPTIONAL)
j. Shape: expected input as 0 or 1; changes from standard pie chart to donut pie chart
k. fillcolor: expected input as hex value; default value = “#000000” (OPTIONAL)
l. textsize: expected input as integer value used as the default value for all text size; default value = 15 (OPTIONAL)
hoverDisplayText(groupName,[count],[uniqueName],[x],[y],[w],[h])

a. groupName: display name for groupTitleArray (see pieClass 2. for more info)
b. count: display name for count (see pieClass 4. for more info)
c. uniqueName: display name for uniqueTitle (see pieClass 3. for more info); default value=‘null’ (OPTIONAL)
d. x: expected input integer as the x-coordinate of origin of the hover key; default value=10 (OPTIONAL) (note: making the value 0 will mess up alignment)
e. y: expected input integer as the y-coordinate of origin of the hover key; default value=10 (OPTIONAL)(note: making the value 0 will mess up alignment)
f. w: expected input integer as the hover key width; default value=50 (OPTIONAL)
g. h: expected input integer as the hover key height; default value=50 (OPTIONAL)
Abstract
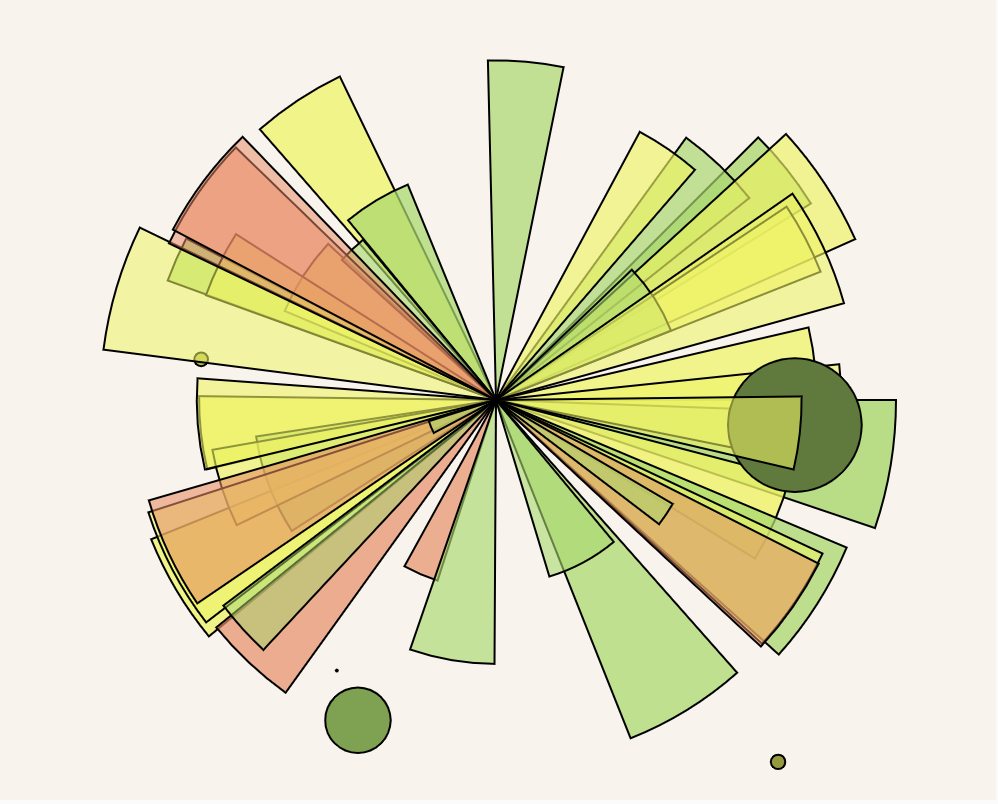
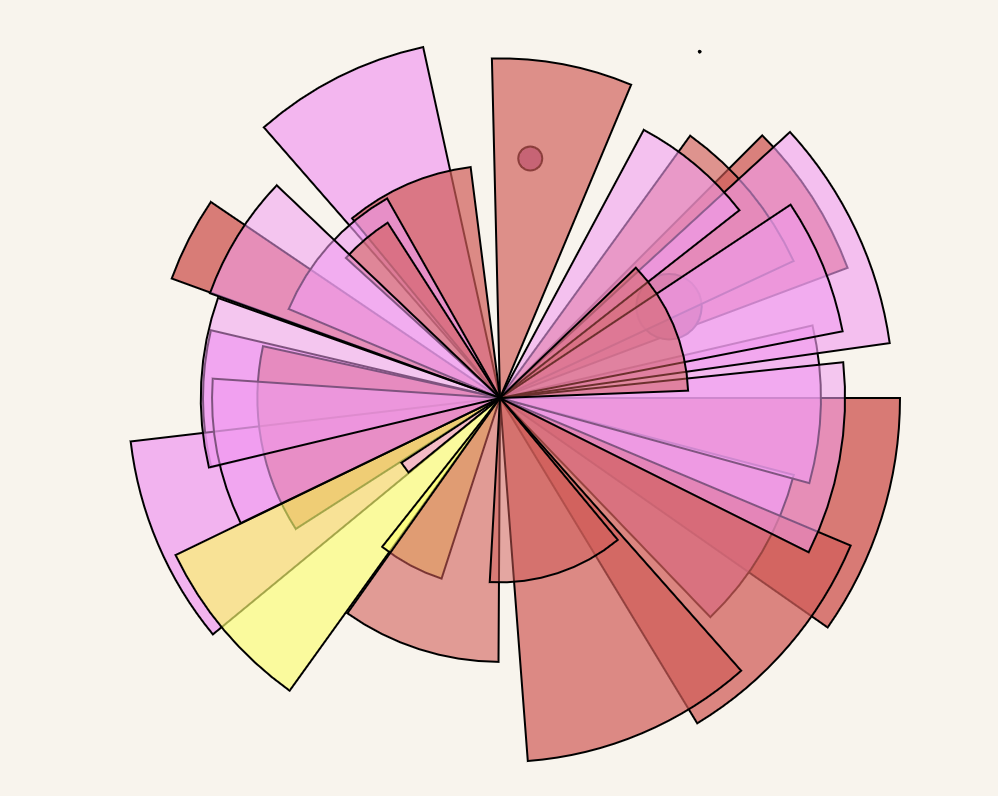
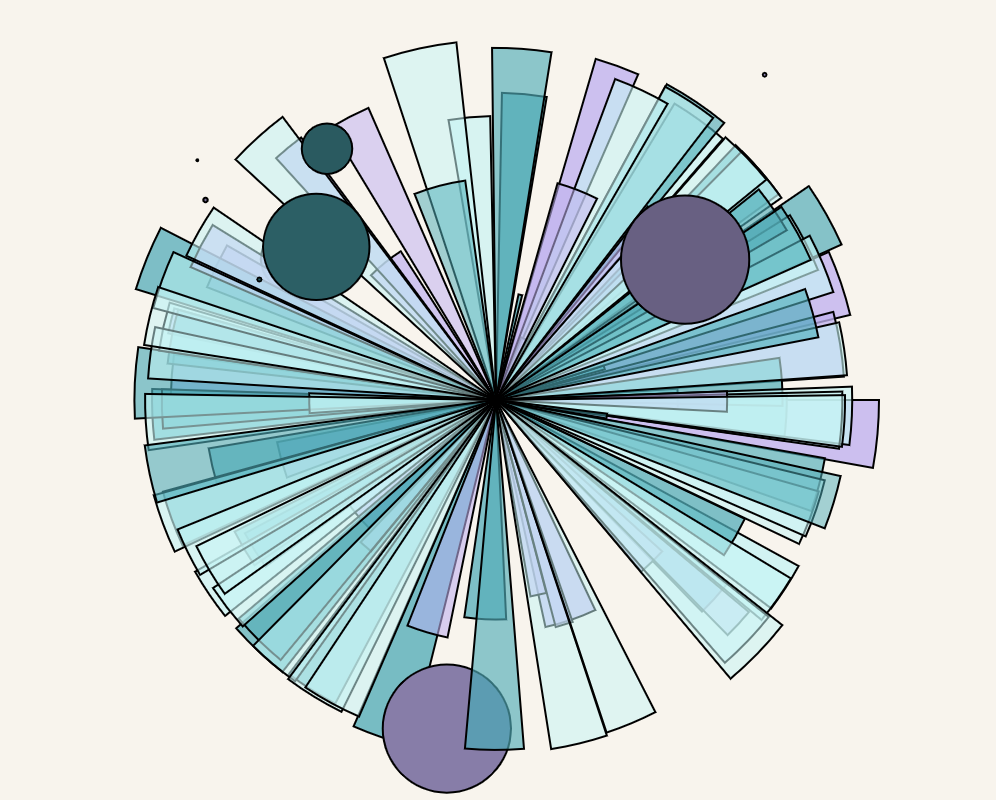
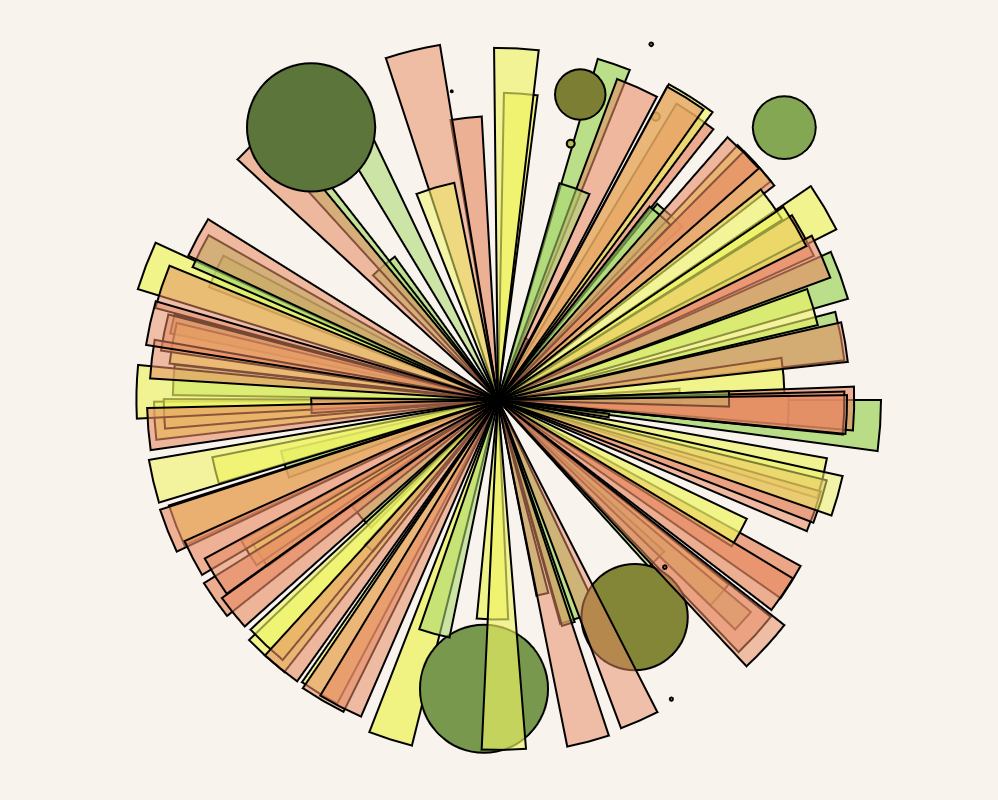
Functions:
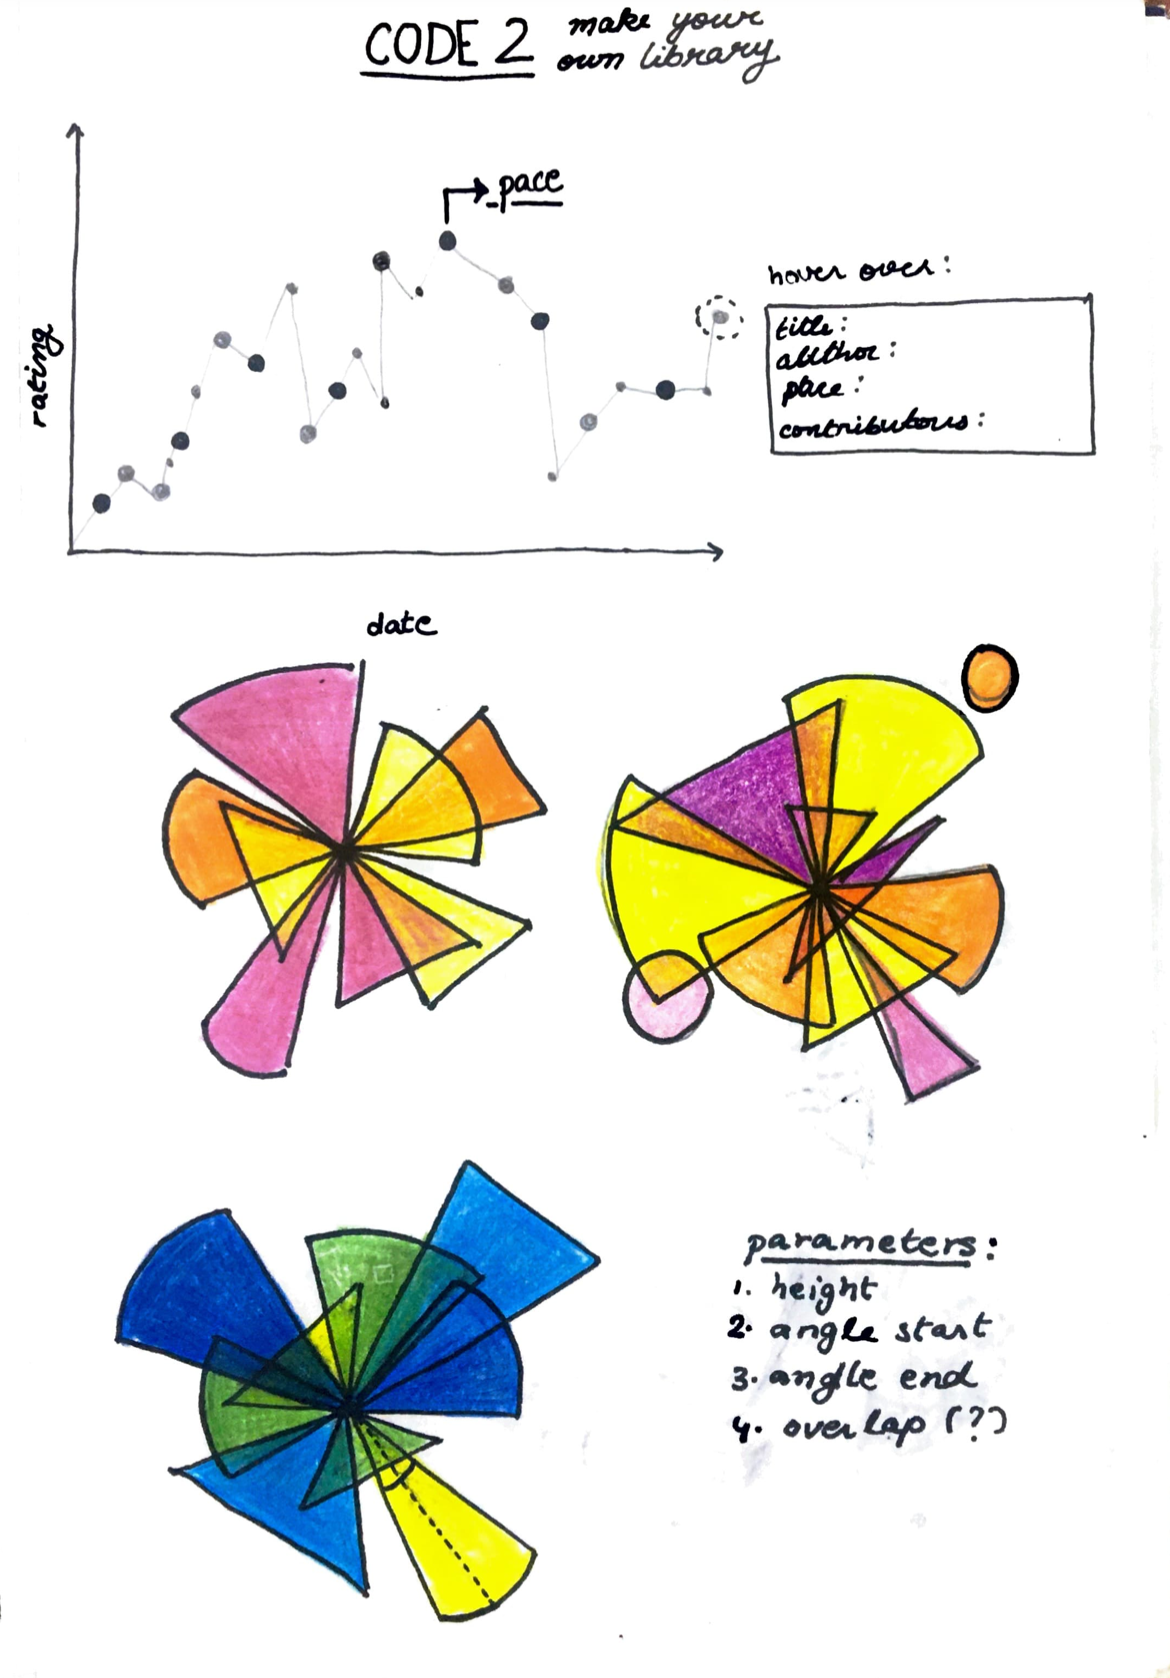
abstractClass(fileName, uniqueTitle, xTitleArray, yTitleArray,[zTitleArray], [xPos],[yPos],[pieWidth],[pieHeight],[radius],[textsize])
1. fileName: expected input string of the CSV file from where data is pulled
2. uniqueTitle: expected input array with all unique elements from the CSV file
3. xTitleArray: expected input array containing the x values elements from the CSV file
4. yTitleArray: expected input array containing the y values value elements from the CSV file
5. zTitleArray: expected input array containing the z values elements from the CSV file, should have 3 unique values; default value=‘null’ (e.g.,[fast, fast, slow, medium, slow, fast])(OPTIONAL) (note: default doesn’t work yet)
6. xPos: expected input integer as the x-coordinate of origin of the chart; default value=0 (OPTIONAL)
7. yPos: expected input integer as the y-coordinate of origin of the chart; default value=0 (OPTIONAL)
8. pieWidth: expected input integer as the chart width; default value=width of canvas (OPTIONAL)
9. pieHeight: expected input integer as the chart height; default value=height of canvas (OPTIONAL)
10. radius: expected input integer as the chart radius; default value=height of canvas/2 (OPTIONAL)
11. textsize: expected input as integer value used as the default value for all text size; default value = 15 (OPTIONAL)
Design Process
This project was not extremely difficult once I got the hang of the vanillas javascript syntax. The first iteration of it was made in p5.js which allowed me to work through the logic without having to worry about syntax.
I then slowly transferred the text to the vanilla.js. The process involved lots of iterations and changing up the formats to make it more efficient. I also spent a lot of time trying to work out the most efficient method of parsing through the arrays. As I created more and more versions, this process became faster resulting in a lesser number of functions. I still need to add more functions for customisations. The biggest missing piece is the ability to customise the colours in the graph. But, I am overall quite satisfied with the project.
Reflection
This project made me realise the benefits of going into a project with a fully formed plan in your head. I usually have a rough idea and then meander down the a path. And while that process does have some benefits, the clarity from working like this was a welcome change. Additionally, as someone who is alway fascinated with data visualisations, the process of coming up with new, creative ways of representation is extremely fascinating to me and I hope to carry this forward with my other practices.
Reference